Inventions & Discoveries · Writing and counting
Mercator projection
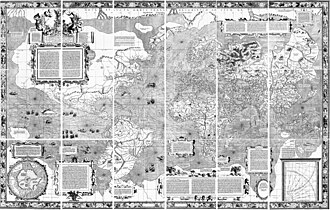
The Mercator projection is a way of drawing the globe on a flat map in which courses of constant compass bearing, rhumb lines, appear as straight lines, so that a chart serves sailors directly. Gerardus Mercator introduced it on his world map of 1569, printed from 18 copper plates he engraved himself, by increasing the degrees of latitude towards each pole as the parallels lengthen. He left no account of his method, and Edward Wright and others later showed how to calculate the latitude scale exactly. Acceptance was slow and came only with the French sea atlas Le Neptune Francois at the end of the seventeenth century; the projection is still the basis of navigation charts.
On the inventions tree
- First known
- 1569
- Credited to
- Gerardus Mercator
See also


Cite this entry
- APA
- The Epoch Institute. (2026). Mercator projection. In The Epoch Institute Encyclopedia. https://the-epoch-institute.org/encyclopedia/mercator-projection
- MLA
- “Mercator projection.” The Epoch Institute Encyclopedia, The Epoch Institute, 2026, https://the-epoch-institute.org/encyclopedia/mercator-projection. Accessed .
- Chicago
- The Epoch Institute. “Mercator projection.” The Epoch Institute Encyclopedia. 2026. https://the-epoch-institute.org/encyclopedia/mercator-projection.
- Harvard
- The Epoch Institute (2026) ‘Mercator projection’, The Epoch Institute Encyclopedia. Available at: https://the-epoch-institute.org/encyclopedia/mercator-projection (Accessed: ).
Last reviewed October 2026Random entry ↻